It was a Tuesday afternoon. A client pinged me saying users weren’t receiving welcome emails — had been that way for three hours. The queue worker had silently crashed, jobs were piling up, and nobody knew. Not me, not the server, not the app. That’s the day I started taking app health monitoring seriously, and that’s the day I found spatie laravel health — a package that should honestly be in every production Laravel app by default.
Why spatie laravel health Is a Must for Production Apps
Here’s the uncomfortable truth: most Laravel apps go live with zero health monitoring. You deploy, cross your fingers, and wait for users to tell you something’s broken.
Queue workers crash and nobody notices. The cache driver disconnects. The disk fills up to 95% and suddenly your app can’t write logs, upload files, or do anything useful. These aren’t rare edge cases — they happen to real apps running on real servers, and the only way you find out is when a user complains.
The problem isn’t that these failures happen. It’s that you have no visibility into them.
No visibility means no control. You’re flying blind. And that’s fine in development, but in production? That’s how you lose users and trust.
Most monitoring tools either cost money, require heavy setup, or just check if your server responds with a 200 — which doesn’t tell you anything meaningful. Your app can return 200 while the queue is dead, the cache is misconfigured, and the disk is almost full. A green uptime badge doesn’t mean your app is actually working.
What Is spatie/laravel-health?
spatie/laravel-health is a Laravel package built by the team at Spatie — the same people behind 350+ open source Laravel packages you’re probably already using (think laravel-permission, laravel-medialibrary, laravel-activitylog).
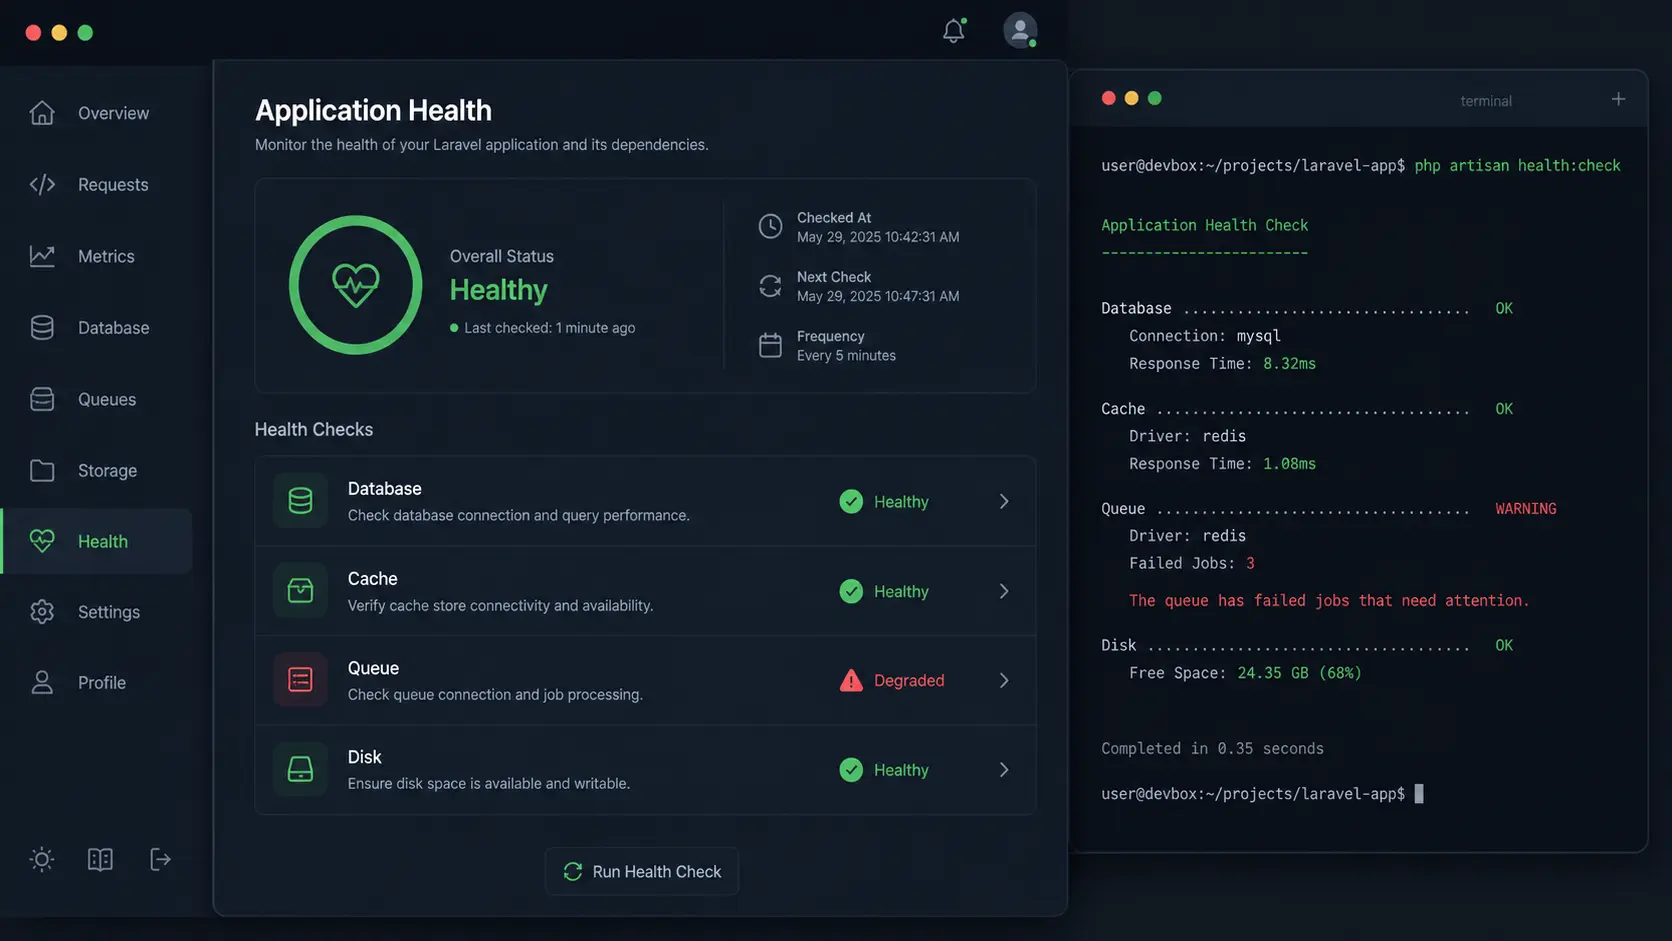
The package gives you a clean health check dashboard that monitors the critical parts of your Laravel application. Each check runs, returns a status, and you see green or red — simple as that.
Here’s what comes built-in out of the box:
- DatabaseCheck — confirms your app can connect to and query the database
- CacheCheck — verifies the cache driver is reachable and working
- QueueCheck — confirms jobs are being processed (not piling up silently)
- UsedDiskSpaceCheck — monitors disk usage and warns before it’s too late
- EnvironmentCheck — validates that required
.envvariables are set - HorizonCheck — checks if Laravel Horizon is running (for Redis queue users)
- DebugModeCheck — alerts you if
APP_DEBUG=trueis on in production (yes, it happens) - RedisCheck — verifies your Redis connection is alive
- Custom checks — write your own in minutes
This package is genuinely underrated. I rarely see it mentioned in Laravel communities, and that’s a shame — it solves a real problem with almost zero friction.
Installing spatie/laravel-health Step by Step
Setup is straightforward. Here’s how to get it running.
Step 1 — Install via Composer
composer require spatie/laravel-healthStep 2 — Publish Config and Migrations
php artisan vendor:publish --tag="health-config"
php artisan vendor:publish --tag="health-migrations"
php artisan migrateThe migration creates a table to store the results of each health check run. This lets you see historical data, not just the current state.
Step 3 — Register Your Health Checks
Open your AppServiceProvider (or create a dedicated HealthServiceProvider if you prefer things tidy) and register the checks you want to run:
use Spatie\Health\Facades\Health;
use Spatie\Health\Checks\Checks\DatabaseCheck;
use Spatie\Health\Checks\Checks\CacheCheck;
use Spatie\Health\Checks\Checks\QueueCheck;
use Spatie\Health\Checks\Checks\UsedDiskSpaceCheck;

public function boot(): void
{
    Health::checks([
        DatabaseCheck::new(),
        CacheCheck::new(),
        QueueCheck::new(),
        UsedDiskSpaceCheck::new()
            ->warnWhenUsedSpaceIsAbovePercentage(70)
            ->failWhenUsedSpaceIsAbovePercentage(90),
    ]);
}What each check does in plain terms:
DatabaseCheck— runs a quick query to confirm DB connectivityCacheCheck— writes and reads a value from your cache driverQueueCheck— dispatches a special job and verifies it gets processedUsedDiskSpaceCheck— calculates disk usage and compares it to your thresholds
The disk check thresholds are worth tuning. warnWhenUsedSpaceIsAbovePercentage(70) will show a yellow warning at 70%, and failWhenUsedSpaceIsAbovePercentage(90) will go red at 90%. Adjust these based on your server setup.
Running the Health Checks
Manual Check via Artisan
You can run all checks manually at any time:
php artisan health:checkYou’ll see output like this in your terminal:
Database .................. ✅ OK
Cache ..................... ✅ OK
Queue ..................... ✅ OK
Used Disk Space ........... ⚠️ WARNING: Disk usage is at 74%Clean, readable, actionable.
Automated Checks via Scheduler
Manual checks are useful for debugging, but for production you want this running automatically. Add it to your scheduler so checks run every minute:
// Laravel 10 — App\Console\Kernel.php
protected function schedule(Schedule $schedule): void
{
    $schedule->command('health:check')->everyMinute();
}
// Laravel 11 — routes/console.php
use Illuminate\Support\Facades\Schedule;
Schedule::command('health:check')->everyMinute();Why every minute? Because problems can surface fast. A queue that crashes at 2:47 PM should show up on your dashboard at 2:48 PM — not when a user reports it at 4:30 PM.
Make sure your scheduler is actually running on the server. If it’s not, none of this works. Double-check your cron entry:
* * * * * cd /path-to-your-app && php artisan schedule:run >> /dev/null 2>&1Displaying the Health Dashboard
The package ships with a built-in controller that renders a clean HTML dashboard. Register the route in your web.php:
use Spatie\Health\Http\Controllers\HealthCheckResultsController;

Route::get('/health', HealthCheckResultsController::class);Now visit /health in your browser and you’ll see a dashboard with the latest check results — green for passing, yellow for warnings, red for failures.
There’s also a JSON endpoint if you need to hook this into external monitoring tools:
GET /health        → HTML dashboard (human-readable)
GET /health.json → JSON response (machine-readable)Protect This Route in Production
You don’t want your health dashboard exposed to the public. Anyone hitting /health can see details about your infrastructure — database status, queue status, disk usage. That’s information you’d rather not share.
Add middleware protection:
// Option 1 — Auth middleware (requires login)
Route::get('/health', HealthCheckResultsController::class)
    ->middleware('auth');

// Option 2 — Custom middleware to allow only specific IPs
Route::get('/health', HealthCheckResultsController::class)
->middleware('auth:sanctum');Or restrict access to a specific IP range by writing a simple IP-check middleware. Either way, lock it down.
Real-World Example — Monitoring a Production Laravel App
Let me tell you what this looks like in practice.
I have a Laravel SaaS app — a project management tool with a few hundred users. It sends emails, processes file uploads, runs scheduled reports. Standard stuff. The app had been live for about two months when users started complaining that they weren’t getting email notifications.
The queue worker had died sometime in the night. Jobs were queued up fine, but nothing was processing them. The app looked healthy from the outside — requests were returning 200, the homepage loaded fine. But internally, it was silently broken.
After adding spatie laravel health with QueueCheck enabled, I ran a test: killed the queue worker on staging, waited two minutes, and checked the dashboard. Red. Immediately. That would have caught the production issue within minutes instead of hours.
Here’s the full setup I now use on every production app:
use Spatie\Health\Facades\Health;
use Spatie\Health\Checks\Checks\DatabaseCheck;
use Spatie\Health\Checks\Checks\CacheCheck;
use Spatie\Health\Checks\Checks\QueueCheck;
use Spatie\Health\Checks\Checks\UsedDiskSpaceCheck;
use Spatie\Health\Checks\Checks\DebugModeCheck;

Health::checks([
    DatabaseCheck::new(),
    CacheCheck::new(),
    QueueCheck::new()
        ->onQueue('default')
        ->onQueue('emails'),
    UsedDiskSpaceCheck::new()
        ->warnWhenUsedSpaceIsAbovePercentage(70)
        ->failWhenUsedSpaceIsAbovePercentage(90),
    DebugModeCheck::new(),
]);Notice I’m passing specific queue names to QueueCheck. If you have multiple queues — one for default jobs and one for email delivery — you want to check both independently. A general queue check won’t catch a problem on a specific queue.
The DebugModeCheck is also worth adding. You’d be surprised how many production apps run with APP_DEBUG=true because someone deployed quickly and forgot to set the environment variable. This check catches that and flags it as a failure.
Once this is set up, pipe your /health.json endpoint into UptimeRobot, Datadog, or Oh Dear for real-time alerting. The JSON response includes status codes that external tools can interpret. You’ll get a Slack notification or email before your users notice anything is wrong.
Bonus — Writing a Custom Health Check
The built-in checks cover most scenarios, but sometimes you need something specific. Maybe you want to verify that your payment provider’s API is reachable, or that a critical third-party service is up.
Writing a custom check is surprisingly simple:
use Spatie\Health\Checks\Check;
use Spatie\Health\Checks\Result;
use Illuminate\Support\Facades\Http;

class StripeApiCheck extends Check
{
    public function run(): Result
    {
        $response = Http::timeout(5)->get('https://status.stripe.com/api/v2/status.json');

        if ($response->successful()) {
            return Result::make()->ok('Stripe API is reachable');
        }

        return Result::make()->failed('Stripe API is not reachable');
    }
}Register it alongside your other checks:
Health::checks([
    DatabaseCheck::new(),
    CacheCheck::new(),
    QueueCheck::new()->onQueue('default'),
    UsedDiskSpaceCheck::new()->warnWhenUsedSpaceIsAbovePercentage(70)
                            ->failWhenUsedSpaceIsAbovePercentage(90),
    StripeApiCheck::new(),
]);Notice the timeout(5) on the HTTP call. Always set a timeout on external API checks — you don’t want one slow third-party API to hold up all your other health checks.
You can also return intermediate states:
return Result::make()->warning('Stripe API responded slowly');The package supports ok(), warning(), and failed() — which map to green, yellow, and red on the dashboard. Use warning() for degraded-but-not-broken states.
Quick Tips for Production Use
A few things I’ve learned after running this in production on multiple apps:
- Always protect
/health— add auth or IP middleware. Don’t expose infrastructure details publicly. - Run
health:checkevery minute via the scheduler — catching issues in 60 seconds beats catching them in 3 hours. - Connect
/health.jsonto an uptime monitor — UptimeRobot is free and takes 2 minutes to set up. Worth it. - Don’t set disk thresholds too aggressively — warning at 50% will give you false alarms. Warn at 70%, fail at 90%.
- Check each queue by name — if you use multiple queues,
QueueCheck::new()->onQueue('emails')is more useful than a generic check. - Use
DebugModeCheck— it’ll save you from accidentally runningAPP_DEBUG=truein production. - Test everything in staging first — especially
QueueCheck. It dispatches a real job, so make sure your staging queue worker is running when you test. - Don’t ignore yellow warnings — a 74% disk usage warning today becomes a 95% disk full failure next week. Fix the yellow ones.
One Honest Caveat
The QueueCheck works by dispatching a job and verifying it gets processed within a certain time window. This means your queue worker needs to be running for the check to pass. That’s by design — it’s literally checking whether the queue is processing jobs.
But it also means if you run health:check and your queue worker isn’t running (say, on a fresh server setup), the queue check will fail even if everything else is fine. Don’t panic — start the worker and re-run the check.
Every production Laravel app deserves health monitoring, and spatie laravel health makes it genuinely easy to set up — we’re talking 20 minutes from zero to a working dashboard. It’s one of those packages where you add it once and immediately wonder how you shipped apps without it.
Add it to your next project. You’ll thank yourself the first time it catches something before your users do.
Leave a Reply